Here I present a physiological model developed by Phillips and Robinson in a paper publihsed in 2006. The work is of great interest because previous (and most) sleep models, such as the two-process model, were strictly phenomenological and dealt not with the underlying neurophysiology.
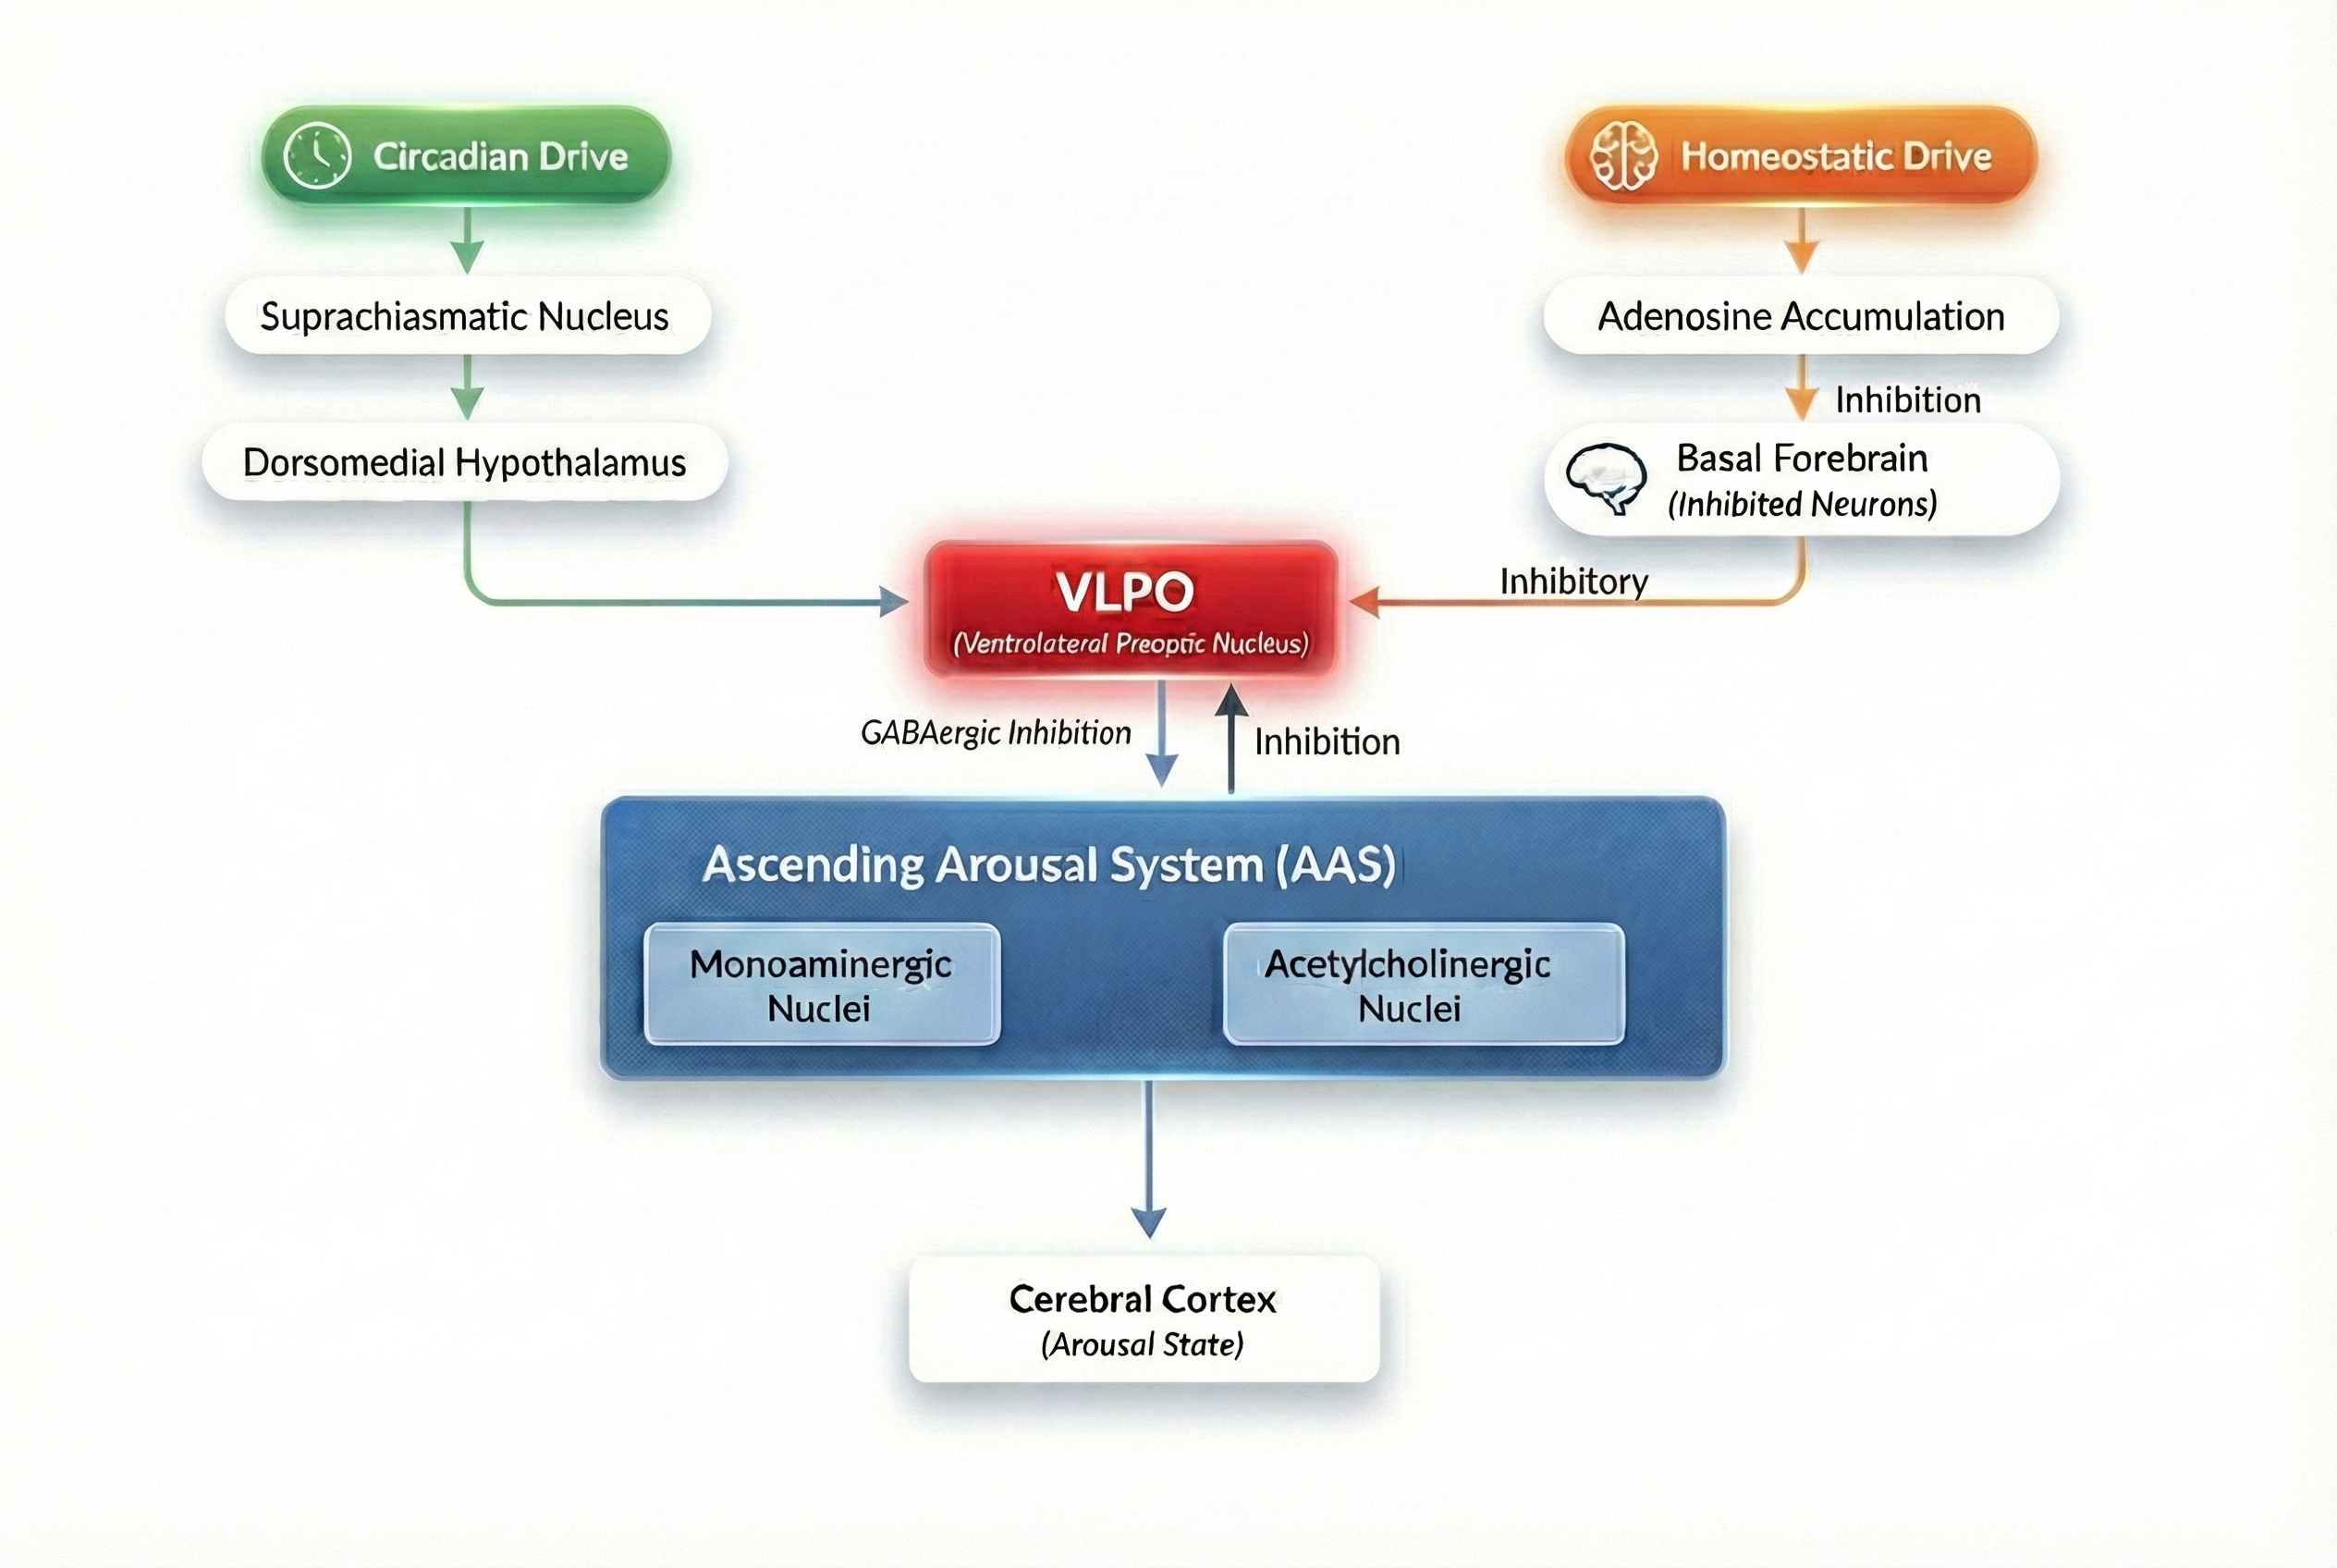
The model is grounded in the dynamics of the ascending arousal system (AAS), a network of cholinergic and monoaminergic nuclei within the brainstem that regulates global arousal through diffuse projections to the cerebrum. AAS activity is modulated by two regulatory forces: the circadian and homeostatic drives, which are integrated in the hypothalamic ventrolateral preoptic area (VLPO). While internal interactions within the AAS generate the ultradian rhythms characteristic of sleep (such as NREM and REM cycles), these higher-frequency dynamics are omitted from the model to focus specifically on the sleep-wake transition.
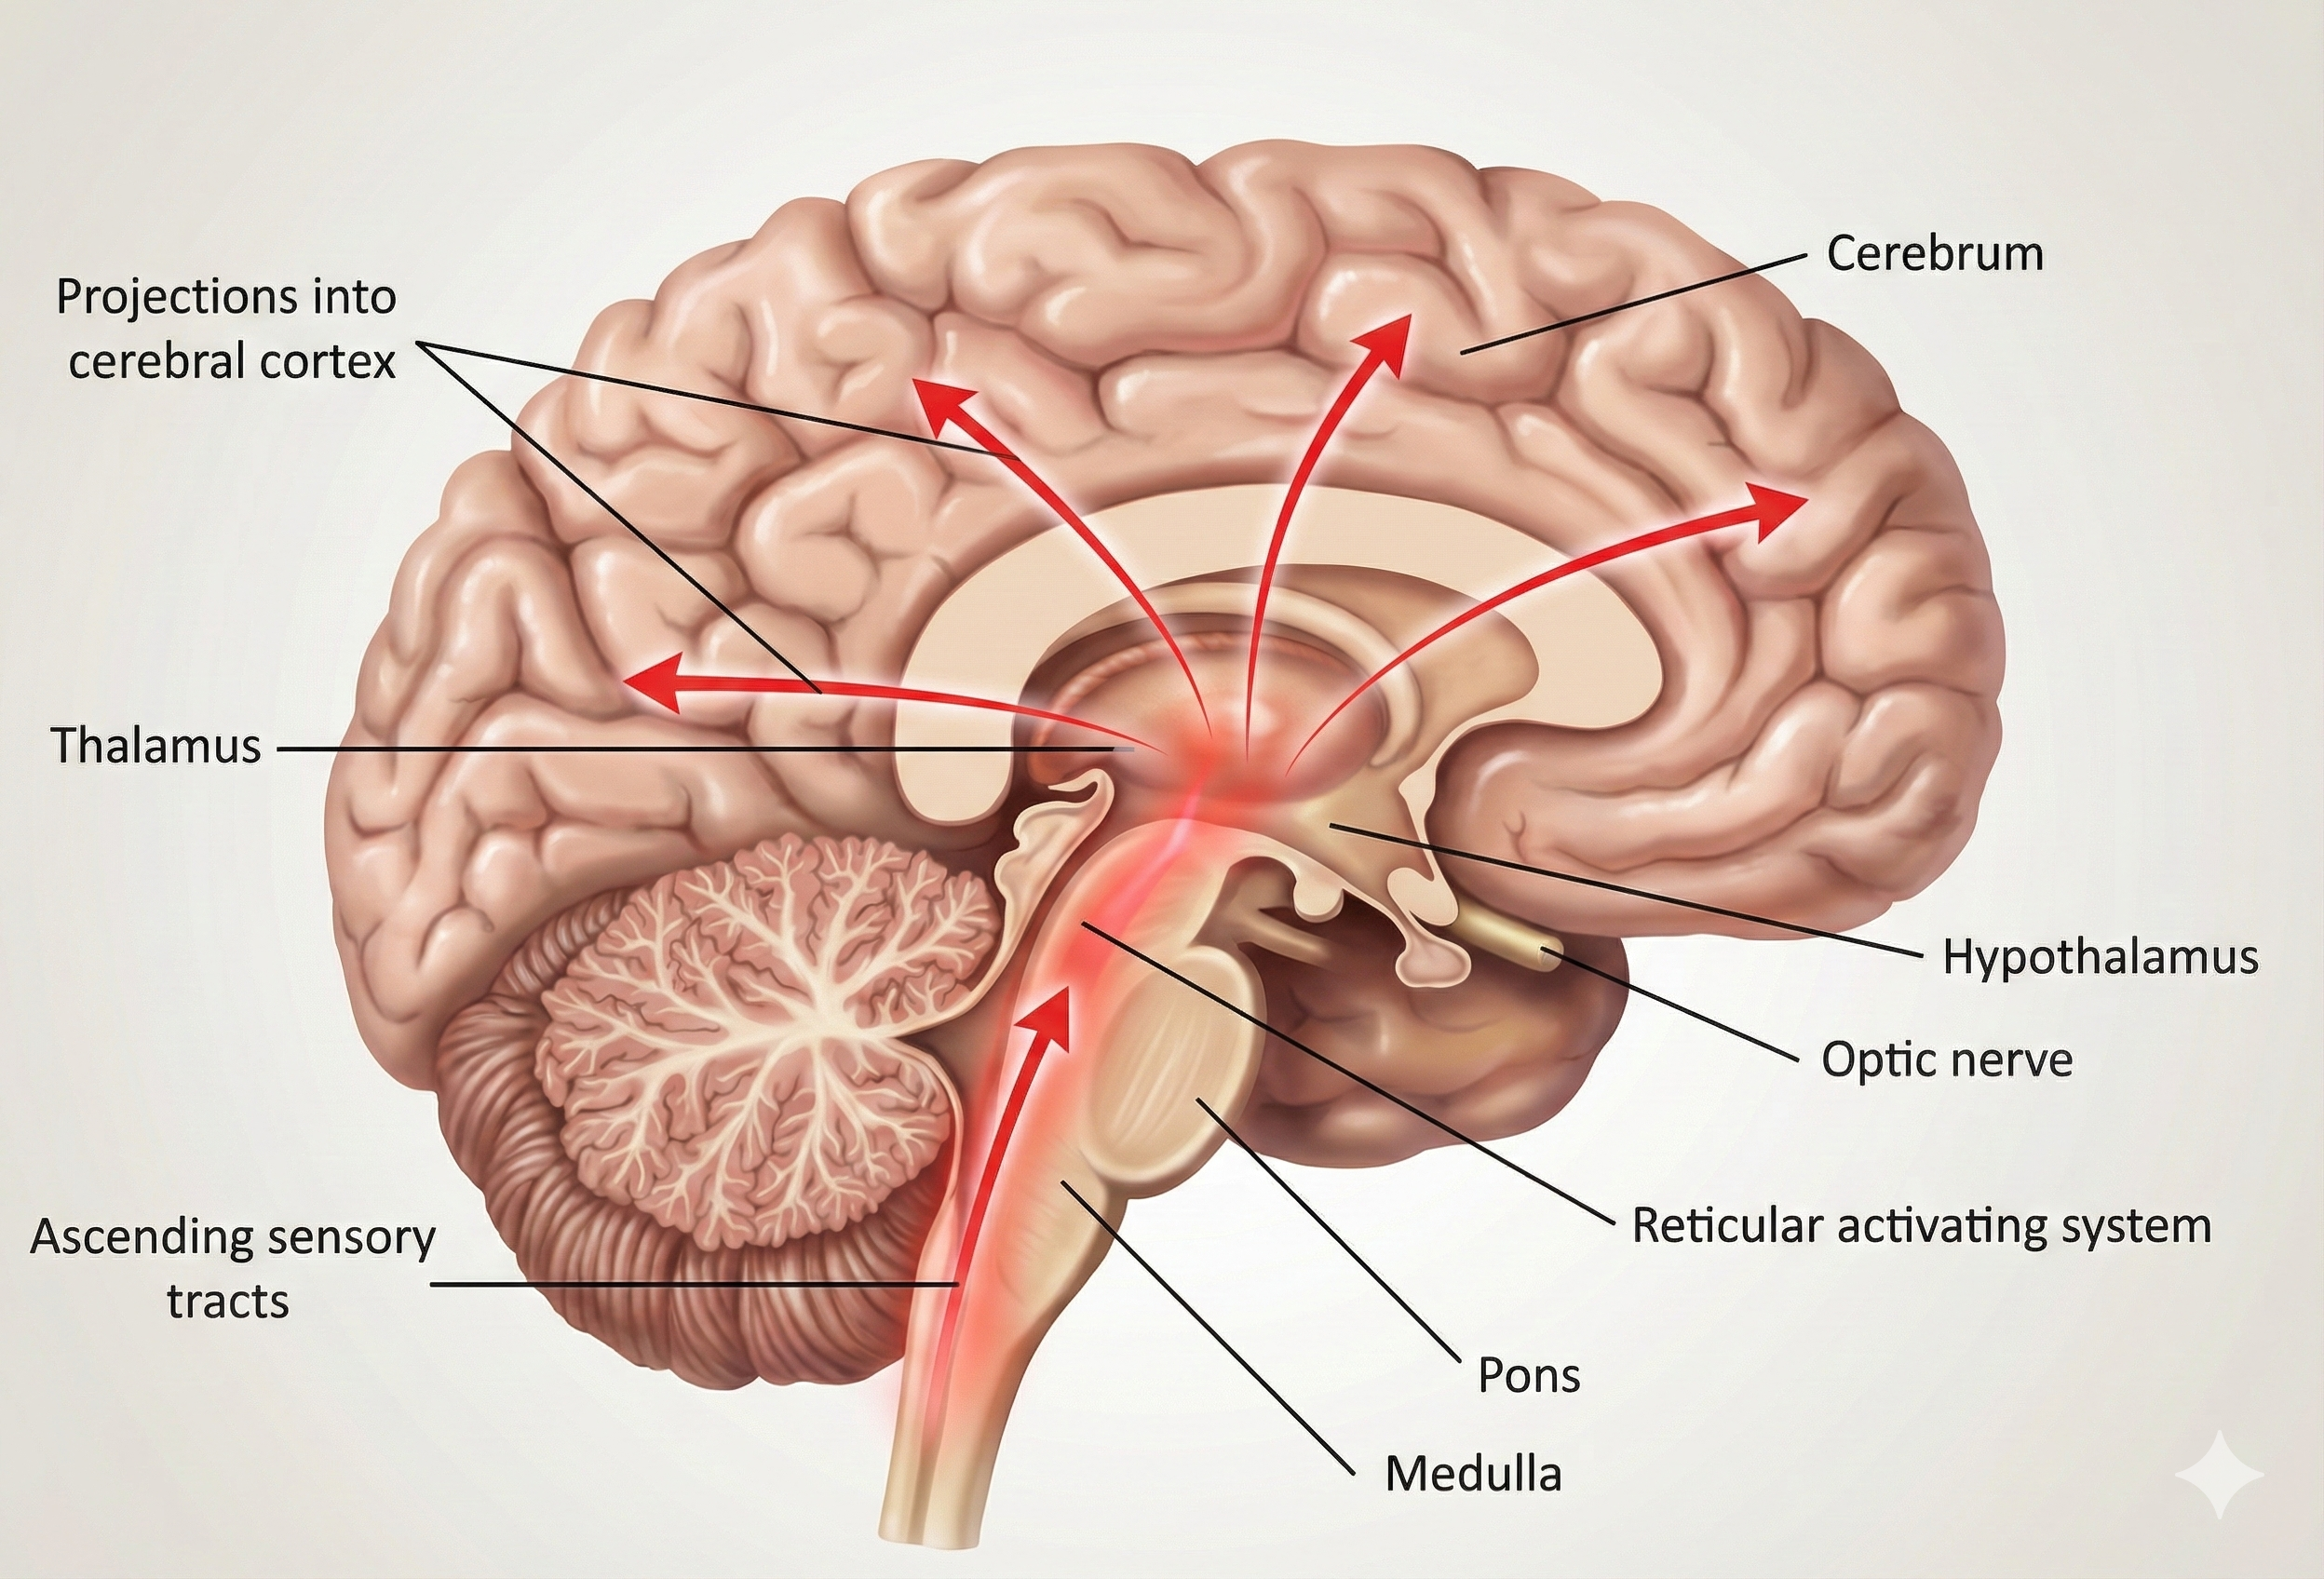
The flow of information through these systems is relatively simple. The homeostatic and circadian drives are both transmitted to the AAS from inhibitory GABAergic projections of the VLPO. The homeostatic signal is caused by the progressive accumulation of adenosin in the extracellular medium of the basal fobrain, which causes the neurons in this region to become inhibited. Since these play an inhibitory role on the VLPO, their own inhibition induces a desinhibition of the VLPO, which itself then signals the AAS more strongly. The circadian signal originates in the suprachiasmatic nucleus and projects to the VLPO via the dorsomedial nucleus of the hypothalamus. It is a fundamentally endogenous oscillator entrained to the day mainly by the influence of light.
In general, it is understood that the monoaminergic nuclei of the AAS promotes wakefulness by forming a mutually inhibitory circuit with the VLPO, which is active during sleep. These two systems are therefore self-reinforcing and conform a flip-flop switch. Contrarily, there is no firm evidence of direct connections from the cholinergic nuclei to the VLPO: it rather seems that the VLPO connects to the cholinergic nuclei via inhibitory interneurorns.
Phillips and Robinson's model, hereby termed the PRM, describes three neural populations: the monoaminergic and cholinergic nuclei in the AAS and the VLPO. As described before, the VLPO integrates the homeostatic and circadian drives and inhibits the AAS, an aspect which the model must capture. Since sleep-wake transitions are modulated by the mutual inhibition between the VLPO and the monoaminergic nuclei, the activity of the cholinergic nuclei is modeled at a constant intermediate level. For further justification of this decision, see the original paper.
As most papers, Phillips and Robinson do not provide an intuition behind the mathematical expressions they use. I should wish to provide an explanation not too detailed that it becomes tedious, but sufficient to make the model accessible to, say, an undergraduate student.
First of all, the PRM model does not deal with individual neurons but rather with neural populations. Topologically, the neural populations may be understood as a dynamically evolving weighted graph: each node is a cluster of neurons with some average firing rate and average voltage, with edges representing the sense and magnitude of the interactions between populations. The dynamism of course comes from fluctuations in the voltage, which in turn must affect the firing rate. In general, the relation between the firing rate of a cluster and its voltage is modeled with a sigmoid function, thus capturing the saturation of the firing rate as voltage increases:
$$Q_a(t) = \frac{ Q_{\text{max}} }{1 + \exp\left( \frac{ V_a(t) - \mu}{\sigma'} \right) }$$
The function $V_a(t)$ is understood to express voltage relative to the average resting potential of the neurons in the cluster. This means that if $V_a(t) = 10\text{mV}$ and the mean resting potential is $-70\text{mV}$, the actual mean voltage of the neurons in the cluster is $-60\text{mV}$. The $\mu$ parameter defines the mean threshold voltage (also relative to resting). This means that when $V_a(t)$ crosses $\mu$, the firing rate $Q_a(t)$ is at half its maximum value. Thus, $\mu$ defines a critical voltage level: below it, most neurons in the cluster are quiescent; above it, most neurons are firing. $\sigma'$ defines the steepness of the sigmoid around $\mu$, and is related to the standard deviation because $\sigma = \sigma' \pi / \sqrt{3}$.
The voltage itself is modeled as a leaky integrator of incoming post-synaptic currents into the neurons of the cluster. For the VLPO, which receives and integrates the circadian and homeostatic drives, we have:
$$\tau_v \frac{dV_v}{dt} = -V_v + w_{vm} Q_m + D$$
where $w_{vm}$ is the weight of the connection from the monoaminergic nuclei to the VLPO, $Q_m$ the firing rate of the monoaminergic cluster, and $D$ is the linear combination of the circadian and homeostatic drives:
$$D = w_{vC} C + w_{vH} H$$
As in the two-process model, the homeostatic drive $H$ is modelled phenomenologically, aiming to capture the metabolic activity that is high during wake and low during sleep. Because arousal correlates highly with monoaminergic activity, the PRM assumes that the homeostatic drive increases proportionally to the firing rate of the monoaminergic nuclei $Q_m$. Also as in the two-process model, $C$ is a simple sinusoidal function with a 24 hour period:
$$C(t) = \cos(\omega t) + \mu_C, \qquad \chi \frac{dH}{dt} = - H + \mu_H Q_m$$
Note that this model of $H$ assumes that when $Q_m = 0$, i.e. during sleep, $H$ is negligible.
The voltage of the monoaminergic nuclei depends on the excitatory input from the cholinergic nuclei and the inhibitory input from the VLPO, from which readily follows the following linear leaky integrator model:
$$\tau_m \frac{dV_m}{dt} = - V_m + w_{mv}Q_v + w_{ma} Q_a$$
The firing rates of the VLPO and the monoaminergic nuclei use the same sigmoid parameters because empirically both populations have similar firing rate dynamics.
As detailed in the original paper, mammalian locus coeruleus neurons have a mean threshold of $-55\text{mV}$ and a resting potential of $-65\text{mV}$, giving a relative threshold of $\mu = 10\text{mV}$. Maximal firing rates under prolonged depolarization of single neurons were around $150$sec$^{-1}$, so we set $Q_{\text{max}} = 150$sec$^{-1}$. $\sigma'$ values within $2-6\text{mV}$ for cortical neurons are typical, and Phillips and Robinson argue that because voltage ranges between cortical and brainstem nuclei neurons are similar, a value of $\sigma' = 3\text{mV}$ is appropriate.
The weights $w_{jk}$, representing the strength and sense of the connections from population $k$ into population $j$, have known signs. The VLPO and the monoaminergic populations, as stated earlier, are mutually inhibitory, from which follows $v_{mv} < 0, v_{vm} < 0$. The cholinergic population excites the monoaminergic population, so $w_{ma} > 0$. The homeostatic drive disinhibits the VLPO, so $w_{vH} > 0$, while the circadian drive inhibits it, so $w_{vC} < 0$.
In the PRM, the flip-flop switch behavior of the sleep-wake cycle entails an equilibrium with two stable fixed points (wake and sleep) and an unstable fixed point (the threshold between sleep and wake). To find steady states, they solve the system of equations given by setting the voltage derivatives to zero:
$$\begin{aligned} 0 &= -V_v + w_{vm} Q_m + D \ 0 &= - V_m + w_{mv}Q_v + w_{ma} Q_a \ \end{aligned}$$
From the second equation, we obtain that the equilibrium voltage satisfies
$$V_m = w_{mv}Q_v + w_{ma} Q_a$$
The firing rate $Q_m$ at equilibrium is a function of the equilibrium voltage, so that we may write $Q_m = S(V_m)$. Thus, from the first equation, it follows
$$0 = -V_v + D + \nu_{vm} S(\nu_{mv} Q_v + \nu_{ma} Q_{ao})$$
So the equilibrium occurs at the roots of the function
$$\begin{aligned} f_v(V_v) &= -V_v + D + w_{vm} S(w_{mv} S(V_v) + w_{ma} Q_a) \ &= \tau_v d\frac{V_v}{dt} \end{aligned}$$
Phillips and Robinson analyze this function and approximate its roots through the roots of two other, related but simpler functions. These roots are
$$K_{v1} = D + w_{vm} S(w_{ma} Q_{ao}), \qquad K_{v2} = D + w_{vm}S \left( w_{mv}Q_{\text{max}} + w_{ma} Q_{ao} \right)$$
Similarly, they found the equilibrium points for the monoaminergic population. Furthermore, since the firing rate of the monoaminergic and the VLPO populations have the same parameters, they reason that the equilibrium points of both populations should be roughly equal, reducing the dimensionality of the problem. Their mathematical analysis is extensive, so I will simply state that they found the wake equilibrium voltage to fall within $-15\text{mV}$ and $-5\text{mV}$, and the sleep equilibrium voltage to fall within $0$ and $1.5\text{mV}$.
Using the same parameters as in the original paper, I implemented the PRM in
Julia using the DifferentialEquations.jl package, as seen below:
using DifferentialEquations, Plots

# Sigmoid Function (Firing Rate Q as a function of Voltage V)
# Parameters from Phillips & Robinson 2007 (Table 2)
# Qmax = 100 sec^-1, theta = 10 mV, sigma_prime = 3 mV
S(V) = 100.0 / (1 + exp(-(V - 10.0) / 3.0))

# ODE System
function phillips_robinson!(du, u, p, t)
    Vv, Vm, H = u

    tau_v = 10.0 / 3600.0   # 10s converted to hours
    tau_m = 10.0 / 3600.0   # 10s converted to hours
    v_vm  = -1.9            # mV*sec
    v_mv  = -1.9            # mV*sec
    v_ma_Qa = 1.0           # constant ACh excitation (mV)
    v_vc  = -6.3            # Circadian weight (mV)
    v_vh  = 0.19            # Homeostatic weight (mV/nM)
    chi   = 10.8            # Clearance time (h)
    mu    = 1.0e-3          # Production rate (nM*h)
    omega = 2π / 24.0       # Circadian frequency

    Qm = S(Vm)
    Qv = S(Vv)

    C = 0.5 * (1.0 + cos(omega * t))
    D = v_vc * C + v_vh * H

    du[1] = (-Vv + v_vm * Qm + D) / tau_v             # dVv/dt
    du[2] = (-Vm + v_mv * Qv + v_ma_Qa) / tau_m       # dVm/dt
    du[3] = (-H + mu * Qm * 3600.0) / chi             # dH/dt (Qm in sec^-1 converted to h^-1)
end

# Solving via DifferentialEquations.jl
u0 = [-11.0, 1.0, 8.0]   # Initial conditions (Wake state)
tspan = (0.0, 48.0)      # 48 hours
prob = ODEProblem(phillips_robinson!, u0, tspan)
sol = solve(prob, Tsit5(), reltol=1e-8, abstol=1e-8)

# Plotting data
t = sol.t
H = [u[3] for u in sol.u]
Qv = [S(u[1]) for u in sol.u]
Qm = [S(u[2]) for u in sol.u]
Qa = fill(1.5, length(t)) # Constant ACh firing rate assumed in model

# 5. Multi-panel Plotting
p1 = plot(t, H, ylabel="H (nM)", title="Homeostatic Drive", color=:red, legend=false)
p2 = plot(t, Qv, ylabel="Qv (Hz)", title="VLPO Firing Rate", color=:blue, legend=false)
p3 = plot(t, Qm, ylabel="Qm (Hz)", title="MA Firing Rate", color=:green, legend=false)

plot(p1, p2, p3, layout=(3,1), size=(800, 1000), margin=5Plots.mm)
The resulting plot is shown below.
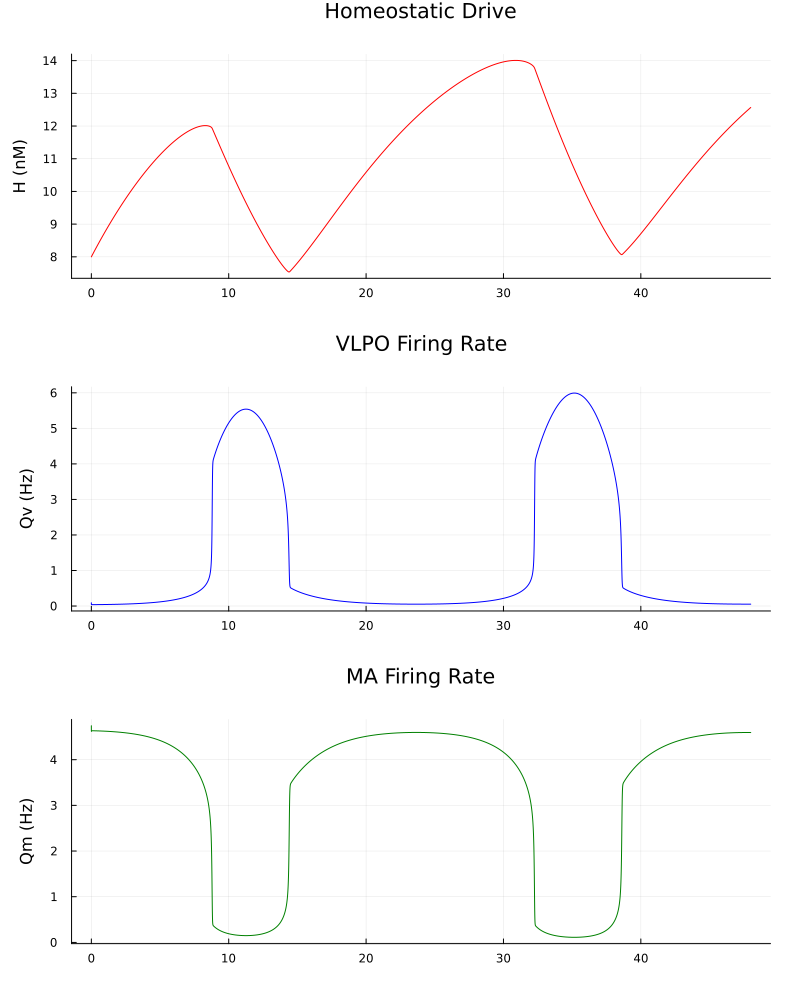
As stated earlier, the homeostatic drive reflects metabolic activity, such as the accumulation of somnogens, during wakefulness. It peaks around $12$ to $14\text{nM}$ before declining exponentially once sleep begins and clearance exceeds production. This build-up of homeostatic pressure, combined with the circadian signal, eventually overcomes the mutual inhibition between the neural populations, triggering a rapid transition. As seen in the VLPO and MA firing rate plots, the system spent most of its time in two stable steady states: wakefulness, characterized by high monoaminergic activity ($Q_m \approx 4-5\text{ Hz}$) and low sleep-promoting activity, and sleep, where the VLPO becomes active ($Q_v \approx 4-6\text{ Hz}$) and suppresses the arousal system.
The model can be used to explore the dynamics of sleep deprivation as well. Sleep deprivation is simulated by applying an external wake-promoting drive that forces the monoaminergic (MA) system to remain active despite increasing pressure to sleep. This forced wakefulness keeps the VLPO sleep switch inhibited, preventing the natural flip-flop transition from occurring at the usual time. As a result, the homeostatic drive continues to rise far beyond its normal peak. By the end of the deprivation period, this homeostatic pressure becomes so immense that it saturates the system. Once the external drive is removed, the brain undergoes a rapid, intense transition into "recovery sleep". The plot below illustrates this phenomenon: after a 24-hour period of standard dynamics, a forced wakefulness is imposed for for 48 hours.
